
In this article, we will be discussing about cryptocurrency charts, technical analysis and how to trade cryptocurrency for beginners.
Introduction to Reading Cryptocurrency Charts
When it comes to reading cryptocurrency charts, there are a few different schools of thought – technical analysis, Dow’s theory, and candlesticks charting. Each has its own strengths and weaknesses, so it’s important to understand all three before making any decisions about where to invest your money.
Technical analysis is the study of past price movements in order to predict future behavior. This approach relies on indicators and patterns that can be used to identify trends and make predictions about where the market is headed.
Dow’s theory is a bit more complicated, but essentially it states that the market is efficient and that prices move in trends. This theory can be used to identify support and resistance levels, which can be helpful when deciding when to buy or sell.
Candlesticks charting is a Japanese technique that uses special candlestick formations to identify potential reversals in the market. This approach can be useful for short-term traders who are looking to take advantage of small price changes.
Technical Analysis
Technical analysis is a method of evaluating assets based on past price movements and patterns. Technical analysts believe that history repeats itself, so by studying past price movements they can get a better idea of where prices are likely to go in the future.
There are many different techniques that fall under the technical analysis, but some of the most popular indicators used by crypto traders include moving averages, Fibonacci retracements, and Bollinger Bands.
Technical analysts believe that the collective actions of all the participants in the market, such as price changes and volume, can be used to identify patterns that can be used to predict future market activity.
Dows Theory
Dow’s theory is a market strategy that was developed by famed investor Charles Dow back in the late 1800s. The theory states that there are three primary trends that markets move in: uptrends (when prices are consistently moving higher), downtrends (when prices are consistently moving lower), and sideways or range-bound markets (when prices fluctuate between two defined levels).
Many crypto traders use Dow’s theory as a way to identify market trends and make trading decisions accordingly.
Dow’s theory is one of the most commonly used technical analysis tools. It states that the market is composed of three types of trends: primary, secondary, and tertiary. Primary trends last for a year or more and tend to be very stable. Secondary trends last for several weeks or months and are usually characterized by sharp price movements. Tertiary trends last for days or weeks and are often much smaller in amplitude.
Candlestick
Candlestick charting is a popular form of technical analysis that uses candlesticks (stick-shaped charts) to indicate price movements. Each candlestick represents the price action for a specific period of time, and traders can use them to look for patterns that can give them an edge in the market.
Candlesticks charts are another popular technical analysis tool. Candlesticks provide a graphical representation of price action over a given period of time. They can be used to identify trend reversals, support and resistance levels, and potential breakout points.
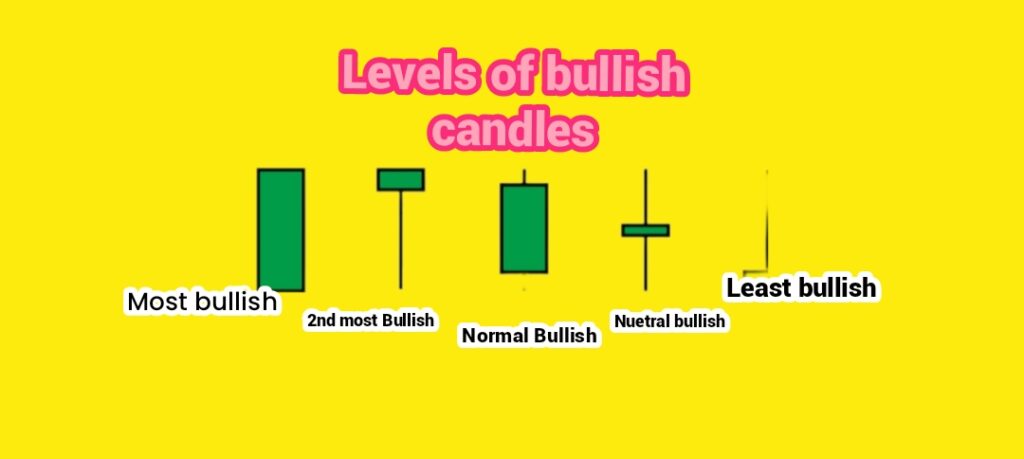
The candlesticks chart is composed of individual candlesticks, each of which represents the price action for a specific time period. The body of the candlestick represents the opening and closing price for the time period, while the wicks represent the high and low prices during that same period.
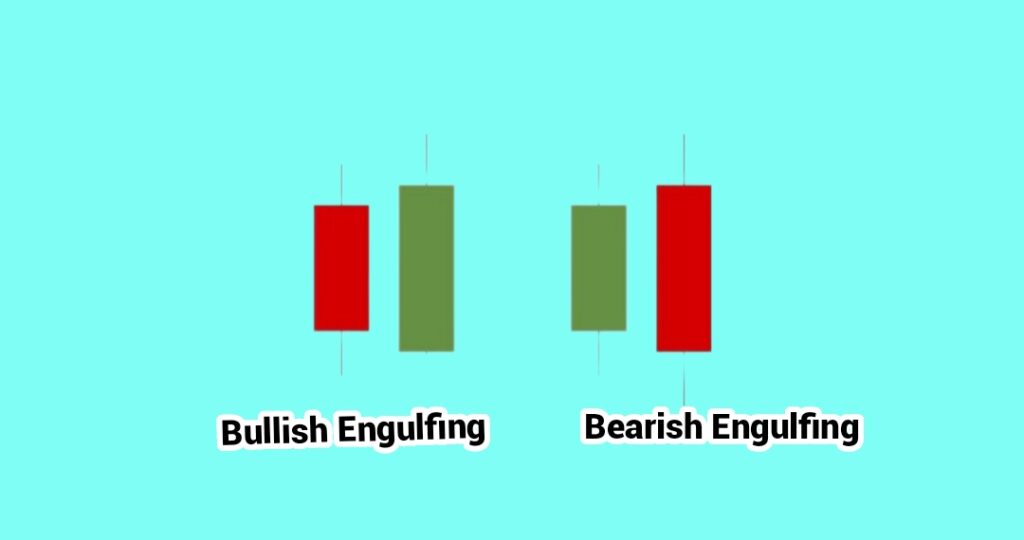
There are many different ways to interpret candlesticks charts, but one common method is to look for patterns that can predict future price movements. For example, bullish engulfing patterns occur when a small candlestick is followed by a large candlestick whose body completely covers the previous candlestick. This is considered a bullish signal as it indicates that buyers are gaining strength.
Another popular way to use candlesticks charts is to identify support and resistance levels. These are areas where the price has difficulty breaking through or falling below certain levels. By identifying these levels, traders can make better informed decisions about where to enter and exit trades.
Whether you’re new to cryptocurrency trading or have been at it for awhile, understanding how to read candlesticks charts can help you make more informed and profitable trades.
Support and Resistance
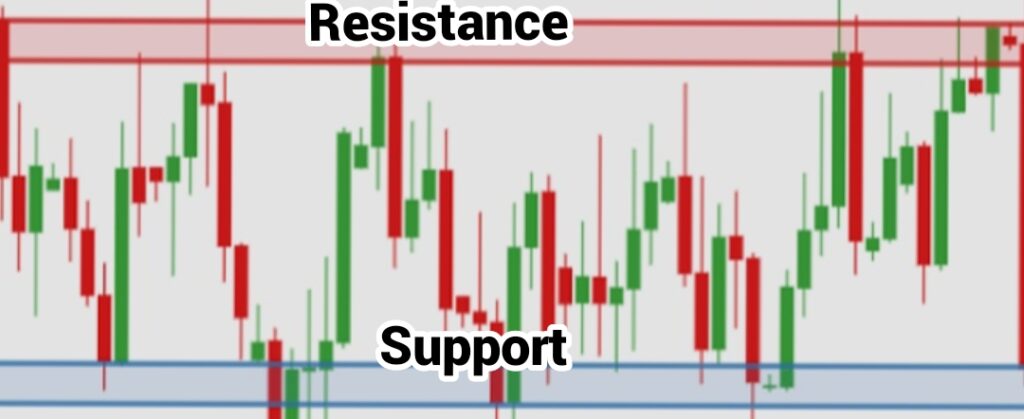
Support and resistance levels are areas on a chart where prices have historically struggled to break through. For example, if prices are approaching a major resistance level, some traders may choose to sell their position in anticipation of a price drop. Similarly, if prices are approaching a major support level, some traders may choose to buy in anticipation of a price rebound.
Support and resistance levels are important concepts in technical analysis.
Support refers to an area where prices have historically found buyers and been resistant to further declines.
Resistance refers to an area where prices have historically been met with selling pressure and been resistant to further advances. These levels can be identified by looking at past price action on a chart.
Technical Indicators
When it comes to cryptocurrency trading, technical analysis is key. By understanding the various technical indicators, traders can get a better sense of where the market is headed and make more informed trading decisions.
One important technical indicator is support and resistance level.
Support and resistance levels are price levels at which the market has a tendency to reverse direction. In other words, they are areas where buyers or sellers are likely to step in and push prices in the opposite direction.
Support and resistance levels can be identified by looking at past price action. When the market is approaching a support level, it means that prices have been falling recently but there is potential for a reversal. On the other hand, when the market is approaching a resistance level, it means that prices have been rising recently but there is potential for a reversal.
The best way to trade support and resistance levels is to wait for a clear breakout or breakdown. A breakout occurs when prices move above a resistance level or below a support level with significant volume. This can be used as a signal to enter into a trade in the direction of the breakout.
A breakdown occurs when prices move below a support level or above a resistance level with significant volume. This can be used as a signal to enter into a trade in the direction of the breakdown.
When trading support and resistance levels, it’s also important to pay attention to trend lines. Trend lines are used to connect past price points and identify the overall direction of the market.
Moving Average
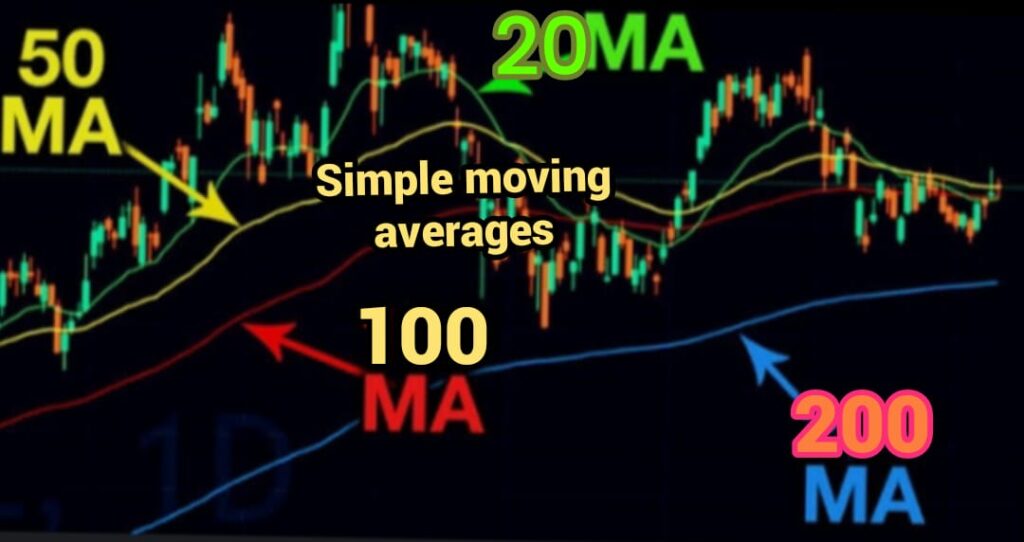
A moving average is a technical analysis indicator that helps smooth out price action by filtering out the “noise” from random price fluctuations. It does this by creating a constantly updated average price based on a certain number of past periods.
There are different types of moving averages, but the most common is the simple moving average (SMA), which is calculated by adding up the closing prices of the past X number of periods and then dividing that by X.
For example, let’s say we have a 10-day SMA. To calculate it, we would add up the closing prices for the past 10 days and then divide that by 10. This gives us an average price that we can use to better understand what the underlying trend might be.
If prices are consistently above the moving average, it suggests that there is an uptrend in place. Conversely, if prices are consistently below the moving average, it suggests a downtrend. Moving averages can also be used to identify support and resistance levels.
Must read: Mana coin price prediction
Must read:Shiba inu price prediction
Must read: Apple stock price prediction
Must read: cryptocurrency trading bot
Must read:beginners guide to cryptocurrency trading strategy
Must read:Amazon stock price prediction
FAQ
Technical analysis is a method of evaluating securities by analyzing the statistics generated by market activity, such as past prices and volume. Technical analysts do not attempt to measure a security’s intrinsic value, but instead use charts and other tools to identify patterns that can suggest future activity.
Dow’s Theory is a market principle created by early 20th century economist and journalist Charles Dow. The theory states that the market consists of three phases: an accumulation phase, in which savvy investors buy stock quietly; a markup phase, in which public excitement about the stock grows and drives up the price; and a distribution phase, in which insiders sell their stock to take advantage of high prices before the general public catches on and the price falls again.
A candlestick chart is a type of financial chart that visualizes the price action of a security over time. Each candlestick represents a specific time period, and each one contains four key pieces of information: the open, close, high, and low prices for that period of time. Candlestick charts are often used by technical traders to help identify potential trading opportunities.
In technical analysis, support and resistance levels are certain price points where it is thought that the price of a security will have difficulty rising above (resistance) or falling below (support).